Identifying bullish crypto markets requires recognizing specific technical patterns: consecutive higher highs and lows, RSI readings above 50, MACD crossing above signal lines, and cup-and-handle formations. Cognitive dissonance often prevents traders from acting on these unmistakable signals, especially during volatile periods. Volume spikes at resistance breakpoints typically confirm institutional participation, while Bollinger Band expansion against upper limits suggests mounting momentum. The 2017-2018 bull run exhibited these indicators with textbook clarity—patterns that reward the observant while punishing the hesitant.
Why do so many traders miss the obvious signs of a cryptocurrency bull run until prices have already skyrocketed? The answer lies in the cognitive dissonance between recognizing patterns and acting upon them—a phenomenon exacerbated by the mercurial nature of digital assets.
Successful crypto investors understand that market movements telegraph themselves through consistent price action, where consecutive higher highs and higher lows form unmistakable upward trajectories on charts.
Market mastery comes from recognizing the language of charts—where each higher high and higher low speaks volumes about momentum.
Technical indicators provide the empirical foundation for bullish prognostication.
An RSI comfortably situated above 50 signifies buyer dominance, while MACD crossing above its signal line confirms momentum.
Bollinger Bands widening as prices push against upper limits suggest volatility poised in an upward direction—a quintessential bullish signal when accompanied by increasing volume.
(Traders frequently overlook volume, perhaps the most telling indicator of all.)
Chart patterns offer visual confirmation that cannot be ignored.
Cup-and-handle formations, ascending triangles, and bullish engulfing candles frequently presage significant price appreciation.
The 2017-2018 bull run demonstrated these patterns with textbook precision, yet many investors remained paralyzed by skepticism until Bitcoin had already quadrupled in value.
Volume dynamics reveal institutional participation—a key harbinger of sustained upward movement.
When significant price advances occur alongside heightened trading activity, particularly at resistance breakpoints, this represents not random fluctuation but deliberate capital deployment by informed market participants.
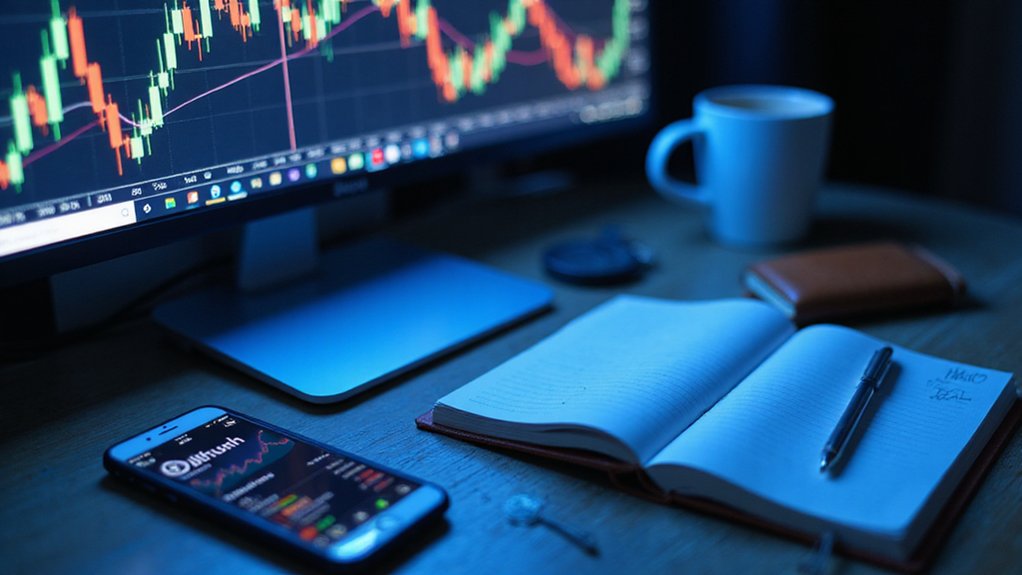
Learning to read candlestick charts effectively can dramatically improve your ability to identify emerging bullish trends before they become obvious to the market majority.
Sentiment analysis further corroborates technical observations.
The Fear and Greed Index, social media discourse, and mainstream coverage collectively form an emotional backdrop against which price movements unfold.
Notably, early bullish phases often coincide with lingering skepticism rather than euphoria.
Macroeconomic conditions—inflation rates, monetary policy decisions, and regulatory developments—provide the contextual framework within which crypto markets operate.
Low interest rates historically correlate with increased appetite for alternative assets, while regulatory clarity removes ambiguity that might otherwise deter institutional capital.
The savvy investor synthesizes these disparate signals into a coherent narrative, recognizing the bull market not when it arrives, but when it begins to form. Moving averages offer reliable trend confirmation when shorter periods cross above longer ones, signaling the beginning of a potential uptrend. Leveraging a reliable crypto signal scanner helps traders detect these profitable opportunities through technical analysis summaries of multiple moving averages and oscillators across various timeframes.
Frequently Asked Questions
How Do I Differentiate Between Temporary Price Surges and Sustainable Bull Markets?
Differentiating between fleeting price surges and sustainable bull markets requires attention to several key indicators.
Genuine bull markets feature sustained price growth supported by robust trading volumes, while temporary spikes often lack this volume confirmation.
Bull markets demonstrate resilience after corrections (rather than collapsing entirely) and coincide with improving fundamentals and broadening adoption.
Social sentiment matters too—but the savvy observer recognizes that Twitter enthusiasm alone rarely sustains long-term appreciation without corresponding institutional interest and technical strength.
Which Specific Cryptocurrencies Typically Lead During Bullish Market Phases?
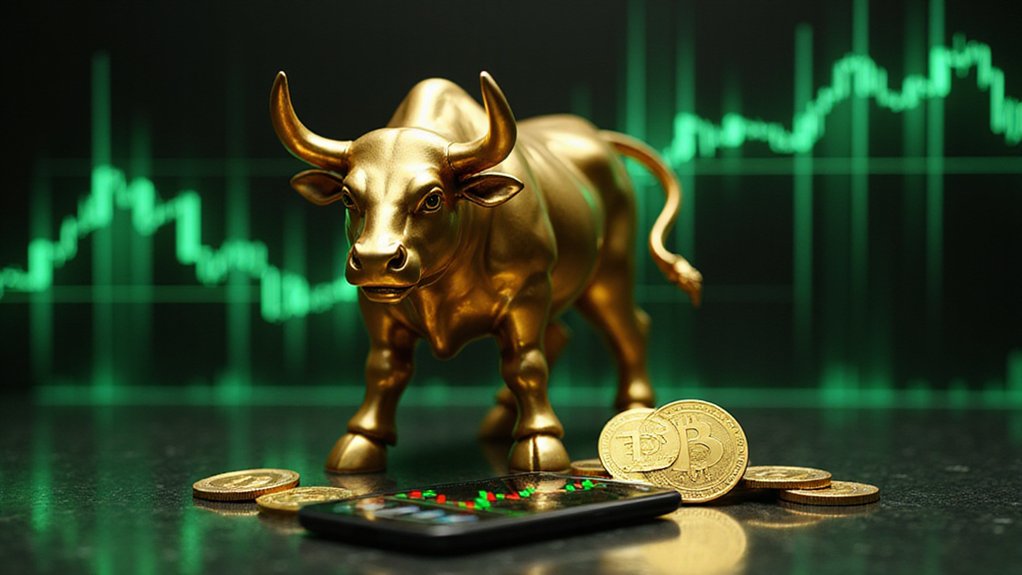
Bitcoin invariably leads bullish market phases, functioning as the proverbial canary in the crypto coal mine.
Ethereum typically follows, catalyzing what analysts term the “smart contract summer” as developers flock to its ecosystem.
After these behemoths establish momentum, mid-cap Layer-1 protocols like Solana and Avalanche tend to outperform, while speculative meme coins and microcaps often experience parabolic (if unsustainable) growth during the market’s euphoric final innings.
This pattern—Bitcoin, Ethereum, altcoins—remains remarkably consistent across cycles.
What Time Frames Should I Monitor to Confirm Bullish Trends?
Effective trend confirmation requires scanning multiple timeframes—each serving distinct analytical purposes.
Day traders benefit from 15-minute and hourly charts to identify momentum shifts, while swing traders extract cleaner signals from 4-hour and daily charts.
For macroscopic perspective (crucial for distinguishing mere rallies from structural bull markets), weekly and monthly timeframes prove indispensable.
The most robust confirmation method? Cross-referencing signals across these temporal layers—when short, medium, and long-term indicators align, conviction naturally follows.
How Do Crypto Bull Markets Correlate With Traditional Financial Markets?
Crypto bull markets increasingly correlate with traditional financial markets through institutional participation and shared risk appetites.
When equities surge, cryptocurrencies often follow suit (though with amplified volatility), while both typically retreat during risk-off periods.
Notably, crypto shows negative correlations with fear indices like VIX about 90% of the time.
The 2023 banking crisis demonstrated this interconnectedness rather starkly—both sectors simultaneously stressed and stabilized, suggesting the days of crypto as a purely uncorrelated asset class are, frankly, over.
When Should I Take Profits During a Crypto Bull Run?
Investors should take profits during a crypto bull run through systematic strategies rather than emotional timing.
Effective approaches include implementing ladder selling (10-20% at predetermined price targets), converting gains to stablecoins, and using trailing stop-losses to protect against sudden reversals.
Technical indicators like RSI overbought readings and volume divergence provide rational exit signals.
The savvy trader balances between capturing tangible returns and maintaining exposure—recognizing that no one perfectly times market tops (an exercise in financial hubris).